A longtime concern regarding the use of remote sensors to monitor CO2 storage projects is their cost relative to traditional sampling measurements. This is particularly true for satellite sensors, which are associated with very high development costs as well as risk that the launch may fail. As sensor costs have decreased, high quality remotely sensed data have become more accessible. It is very unlikely that managers of a sequestration project will commission unique satellite sensors for their specific project, but will more likely rely on an existing sensor operated by commercial or government entities, defraying development costs and risks to these outside vendors. Select existing and proven remote sensing technologies applicable to their specific needs and budgets will allow site managers to keep costs and risks of using remote sensing technology at an acceptable level.1Verkerke, J.L., Williams, D.J., & Thoma, E. (2014). Remote sensing of CO2 leakage from geologic sequestration projects. U.S. Environmental Protection Agency Papers. 221. Retrieved July 1, 2021, from https://core.ac.uk/download/pdf/33134964.pdf
As an example, mapping vegetative stress is an indirect method of documenting locations of CO2 leakage. Induced stress from CO2 has been recognized in the spectral signature of plants over volcanic CO2 vents. There have been extensive efforts to study the response of plants subject to CO2 stress to determine its applicability to the detection of leakages at a carbon storage site. If a leak were to occur, the excess amount of CO2 in the top layers of soil near the surface would stress the vegetation above the storage site, which can be seen as changes in their spectral signatures. If vegetation over a storage site has healthy spectral signatures, the data would indicate that CO2 is being properly stored.2Verkerke, J.L., Williams, D.J., & Thoma, E. (2014). Remote sensing of CO2 leakage from geologic sequestration projects. U.S. Environmental Protection Agency Papers. 221. Retrieved July 1, 2021, from https://core.ac.uk/download/pdf/33134964.pdf3Male, E.J., Pickles, W.L., Silver, E.A. et al. (2010). Using hyperspectral plant signatures for CO2 leak detection during the 2008 ZERT CO2 sequestration field experiment in Bozeman, Montana. Environmental Earth Sciences. 60, 251–261. https://doi.org/10.1007/s12665-009-0372-2
Spectral methods are most commonly used, as the decline in plant health is accompanied by plant chlorophyll absorbing less radiation in visible wavelengths and reflecting less energy at near infrared wavelengths, creating an identifiable spectral signature.4Verkerke, J.L., Williams, D.J., & Thoma, E. (2014). Remote sensing of CO2 leakage from geologic sequestration projects. U.S. Environmental Protection Agency Papers. 221. Retrieved July 1, 2021, from https://core.ac.uk/download/pdf/33134964.pdf
Remote Sensing of Ecosystem Stress Monitoring Summary
- Description: Satellite imagery, aerial photography, and spectral imagery are used to measure vegetative stress resulting from elevated CO2 in soil or air. Ground-based study is required to develop understanding of signal to train the image processing and validate anomalies detected.
- Benefits: Imaging techniques can cover large areas, at relatively high frequency and low cost, and image processing can be automated. Vegetative stress is proportional to soil CO2 levels and proximity to CO2 release.
- Challenges: Detection only possible after sustained CO2 emissions have occurred. Shorter duration release may not be detectable. Natural variations in site conditions make it difficult to establish reliable baseline. Changes not related to CO2 release can lead to false positives. Variable sensitivity of vegetation to CO2 and small areas of focus release can lead to missed signal.5Verkerke, J.L., Williams, D.J., & Thoma, E. (2014). Remote sensing of CO2 leakage from geologic sequestration projects. U.S. Environmental Protection Agency Papers. 221. Retrieved July 1, 2021, from https://core.ac.uk/download/pdf/33134964.pdf

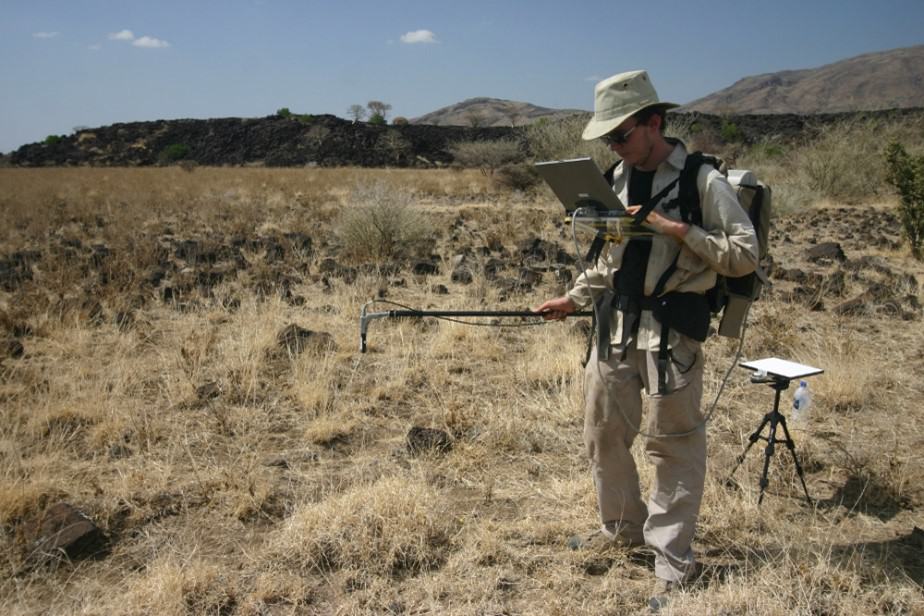
A scientist using a field spectrometer to collect data in the field.6Field Spectroscopy Facility. [n.d.] ASD FieldSpec Pro System. National Centre for Earth Observation, Natural Environment Research Council. Retrieved July 1, 2021, from https://fsf.nerc.ac.uk/instruments/asd_fieldspec.shtml
Application
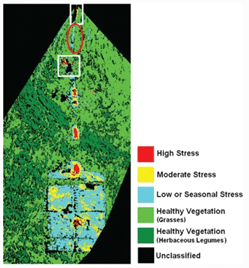
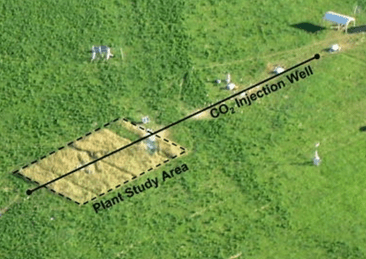
Application of spectral methods for monitoring was studied during a shallow, controlled underground CO2 leak experiment held at Montana State University in Bozeman, Montana in 2008. Scientists injected pure CO2 gas through a horizontal well with perforated sections at depths varying between 1 and 2.5 m in an agricultural field. A 20- x 30-m patch of vegetation was selected for a plant stress experiment and left unmown. Carbon dioxide gas was injected for 29 days into the horizontal well. Spectral signatures were recorded both inside and outside a planned zone of CO2 leakage using both a field spectrometer and airborne imagery acquired from a low-flying aircraft installed with a hyperspectral camera system. Airborne hyperspectral imagery showed patterns of plant stress.7Male, E.J., Pickles, W.L., Silver, E.A. et al. (2010). Using hyperspectral plant signatures for CO2 leak detection during the 2008 ZERT CO2 sequestration field experiment in Bozeman, Montana. Environmental Earth Sciences.60, 251–261. https://doi.org/10.1007/s12665-009-0372-2


Classification of spectral imagery at a field experiment in Bozeman, Montana (left). Aerial photo of site shows the plant study area and injection well line (right). Notice the plant study area at right corresponds to the general light blue area at left. The zones of high plant stress (red) on the left are located along the 100-m long, horizontal CO2 injection well. Carbon dioxide was purposefully leaked to determine the response of monitoring tools in the field. Red areas indicate zones of plant stress caused by the injected CO2.8Verkerke, J.L., Williams, D.J., & Thoma, E. (2014). Remote sensing of CO2 leakage from geologic sequestration projects. U.S. Environmental Protection Agency Papers. 221. Retrieved July 1, 2021, from https://core.ac.uk/download/pdf/33134964.pdf
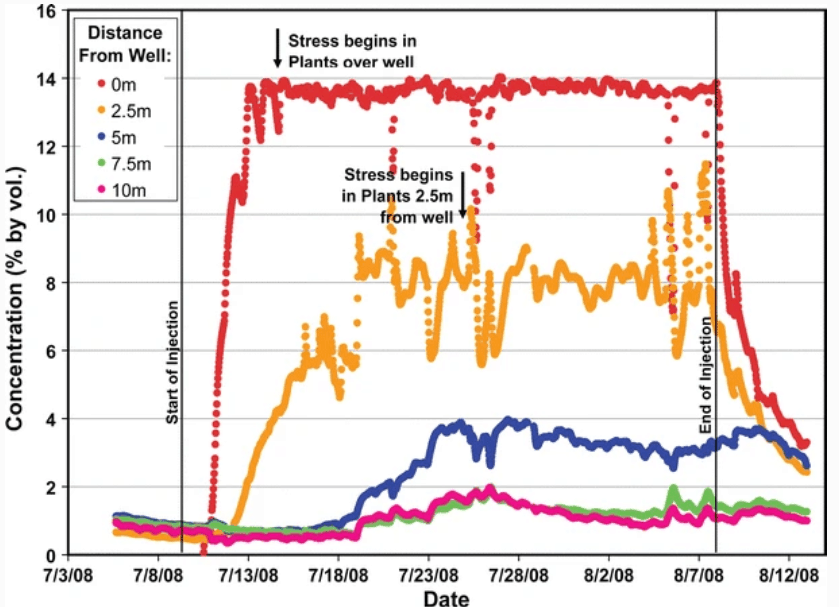
Spectral signatures of the plants were also compared to the CO2 concentrations in the soil. Four to five days after the injection began, stress was observed in the spectral signatures of plants within 1 m of the well. After approximately 10 days, moderate to high amounts of stress were measured out to 2.5 m from the well.9Male, E.J., Pickles, W.L., Silver, E.A. et al. (2010). Using hyperspectral plant signatures for CO2 leak detection during the 2008 ZERT CO2 sequestration field experiment in Bozeman, Montana. Environmental Earth Sciences.60, 251–261. https://doi.org/10.1007/s12665-009-0372-2

Time series of soil CO2 concentrations collected using soil probes located at east edge of plant study area at varying distances from the CO2-injection well.10Male, E.J., Pickles, W.L., Silver, E.A. et al. (2010). Using hyperspectral plant signatures for CO2 leak detection during the 2008 ZERT CO2 sequestration field experiment in Bozeman, Montana. Environmental Earth Sciences. 60, 251–261. https://doi.org/10.1007/s12665-009-0372-2
Image Credits
- scientist using field spectrometer: National Environmental Research Council