Both 2-D and 3-D seismic surveys collect measurements as a function of two-way travel time, or the time it takes for the signal to go from the source at the surface, reflect off some geologic feature, and return to the receivers at the surface. Vertical seismic profile (VSP) surveys, place the receivers down a wellbore, which then measure the seismic signal as a function of vertical position within the formation. These VSP surveys use temporary or permanently installed downhole sensors to create images of the subsurface from the near-surface to a depth at or below the reservoir, similar to surface seismic surveys. Time-lapse VSPs provide vertical resolution that allows detection of reservoir properties such as fluid saturation changes caused by injection or production activities near the borehole containing the receivers (Daley et al., 2007). These tools can be used to monitor the CO2 plume as it migrates away from the injection well.
Emerging technologies such as digital acoustic sensing, which uses fiber optic cables that are permanently cemented downhole to acquire seismic data, may reduce the cost of VSP surveys. The system allows the user to listen to the acoustic field at every point along many kilometers of fiber optic cable deployed in the well. With a spatial resolution of 1 meter, for example, there will be 10,000 synchronized sensors along a 10,000-m fiber.1National Energy Technology Laboratory. (2017). Best practices: Monitoring, verification, and accounting (MVA) for geologic storage projects. National Energy Technology Laboratory, U.S. Department of Energy. https://netl.doe.gov/sites/default/files/2018-10/BPM-MVA-2012.pdf
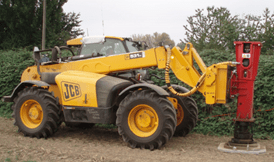
A seismic signal could be produced as rapid series of impacts on a steel ground impact plate in this example from the Ketzin Storage Project in Germany.2Götz, J. (2014). Borehole seismic monitoring of CO2 storage within a saline aquifer at Ketzin, Germany. PhD Dissertation. Technischen Universität Berlin.
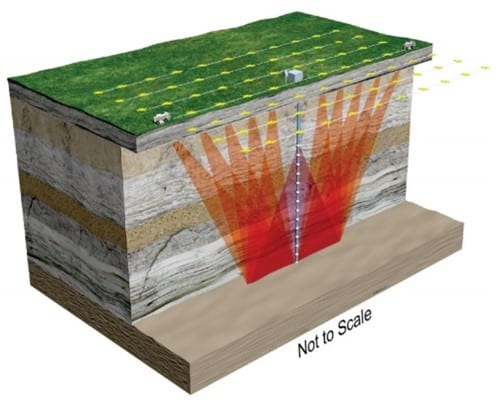
Here a surface grid or array of acoustic source for a VSP survey can provide 3D images in areas where surface seismic data may not provide an adequate image. Note the string of receivers deployed in the well.3Hamling, J.A., Gorecki, C.D., Steadman, E.N., and Harju, J.A., 2011, Subtask 1.3 – Evaluation of geophysical technologies for application to CCS: Final topical report prepared for National Energy Technology Laboratory under Cooperative Agreement No. DE-FC26-08NT43291, Grand Forks, North Dakota, Energy & Environmental Research Center.
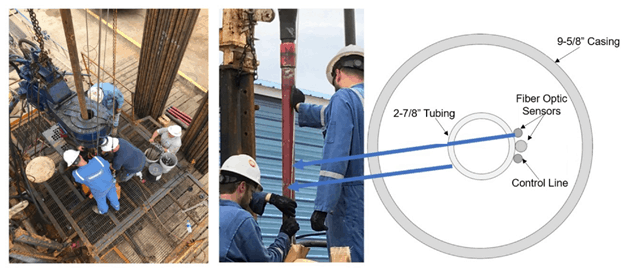
Distributed acoustic sensing offers a viable alternative to geophone (receiver) arrays for the acquisition of seismic data. The fiber optic technology reduces monitoring costs and provides spatially and temporally continuous data. Here, a fiber-optic cable is permanently deployed at a well. Notice the optical sensors are clamped to the outside of the smaller-diameter tubing and then lowered into the well, which is lined with 9-5/8” casing.4Feo G., Sharma J., Kortukov D., Williams W., & Ogunsanwo T. (2020). Distributed Fiber Optic Sensing for Real-Time Monitoring of Gas in Riser during Offshore Drilling. Sensors. 2020; 20(1):267. https://doi.org/10.3390/s20010267
Vertical Seismic Profile Summary
- Description: Seismic geophysical methods use acoustic energy to image the subsurface. Differences between the acoustic properties of CO2 and other fluids enable plume monitoring by seismic methods. Active seismic methods, such as VSP, require a source and receiver. Given their reduced measurement scale, VSP surveys may be better suited for smaller storage projects and it may be possible for a VSP repeat to capture the entire CO2 plume in the subsurface.
- Benefits: Substitution of CO2 for brine under many conditions creates a strong change in seismic velocity ideal for time-lapse quantification from pre-injection baseline (brine-filled) pores to pores partly filled with CO2. Borehole seismic, such as VSP surveys, can provide higher-resolution imaging near or between wellbores.
- Challenges: Geologic complexity and a noisy recording environment can degrade or attenuate surface seismic data and the presence of gas in baseline fluids can reduce detection of CO2. Borehole seismic methods require a wellbore for monitoring. Processing of VSP survey data is specialized and may be cost-prohibitive for smaller projects. VSP surveys only image an area in the near-wellbore environment.5National Energy Technology Laboratory. (2017). Best practices: Monitoring, verification, and accounting (MVA) for geologic storage projects. National Energy Technology Laboratory, U.S. Department of Energy. https://netl.doe.gov/sites/default/files/2018-10/BPM-MVA-2012.pdf
Application
Vertical seismic profiling and distributed acoustic sensing technology have been deployed at the Aquistore Project, a CO2 geological storage in Canada. While a majority of the 1 Mt/yr of CO2 captured at the associated power plant is planned to be sold for enhanced oil recovery (EOR) operations, Aquistore engineers designed a facility for buffer storage against EOR sales fluctuations. As the first project to store CO2 in a deep saline aquifer in Canada, Aquistore has served as a monitoring and science project. Commercial scale CO2 capture began in 2014.6Harris, K., White, D., Melanson, D., Samson, C., & Daley, T. M. (2016). Feasibility of time-lapse VSP monitoring at the Aquistore CO2 storage site using a distributed acoustic sensing system. International Journal of Greenhouse Gas Control, 50, 248-260.
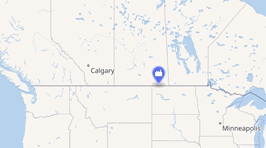
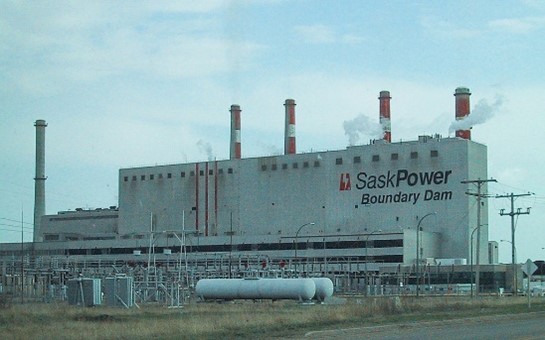
Aquistore, the world’s first combined commercial power plant and carbon capture and storage project, is located in Estevan, Saskatchewan, Canada. CO2 is captured at the nearby SaskPower Boundary Dam coalfired power plant. Following capture, a portion of the CO2 is sold for EOR operations and the remainder is transported by pipeline to the Aquistore site approximately 5km away. The CO2 is injected into a deep reservoir via a 3,000 m injection well.7Boundary Dam Power Station. (2021, April 21). In Wikipedia. https://en.wikipedia.org/wiki/Boundary_Dam_Power_Station
The main objective of the VSP surveys and distributed acoustic sensing was to generate high-resolution seismic images in the vicinity of the borehole to image the spreading of CO2 in the reservoir. As part of early work on the project, seismic modeling was conducted to assess how well the CO2 plume may be imaged at various stages of the injection process. Time-lapse VSP differences were calculated for a range of cumulative CO2 quantities and were compared against the levels of expected repeatability from the field data to assess the likely effectiveness of time-lapse VSP monitoring.8Harris, K., White, D., Melanson, D., Samson, C., & Daley, T. M. (2016). Feasibility of time-lapse VSP monitoring at the Aquistore CO2 storage site using a distributed acoustic sensing system. International Journal of Greenhouse Gas Control, 50, 248-260.
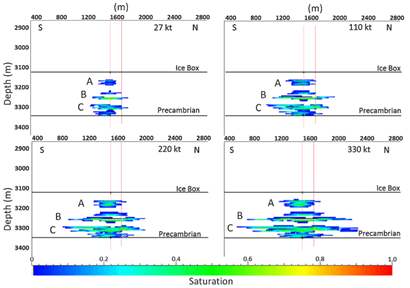
Modeled CO2 saturation (fractional) in storage reservoir after 90 days (=27 kt), 1 year (110 kt), 2 years (220 kt), and 3 years (330 kt) of CO2 injection at a rate of 301 t/day. Injection well for each of the four panels is the red line on the left, observation well is the red line on the right. Note the spread of CO2 saturation from the injection well outward, eventually intersecting the observation, or monitoring, well. Ice Box shales form the primary seal at the top of the storage complex. The injection zone is ~ 200 m thick and located between the Precambrian and the Ice Box, as highlighted by the increase in saturation of CO2 with time.9Harris, K., White, D., Melanson, D., Samson, C., & Daley, T. M. (2016). Feasibility of time-lapse VSP monitoring at the Aquistore CO2 storage site using a distributed acoustic sensing system. International Journal of Greenhouse Gas Control, 50, 248-260.
Engineers concluded that the injected CO2 would be concentrated in three depth intervals (A, B, C shown on the figure) within the reservoir ranging in thickness from 20 to 60 m. Interpretation of the data suggest reservoir performance as follows:
- In each interval, the width of the CO2 plume and the CO2 saturation increase with total quantity of CO2 injected.
- The uppermost plume (interval A) is relatively narrow (240–560 m) and has generally low-to-moderate CO2 saturations.
- The CO2 plumes in intervals B and C are much wider (680–1680 m) and have moderate-to-high CO2 saturations.
- The lowermost interval (C) accepts the most CO2.10Harris, K., White, D., Melanson, D., Samson, C., & Daley, T. M. (2016). Feasibility of time-lapse VSP monitoring at the Aquistore CO2 storage site using a distributed acoustic sensing system. International Journal of Greenhouse Gas Control, 50, 248-260.
Distributed acoustic sensing units have been used at Aquistore since 2013 to provide baseline and monitoring data via VSP surveys, with the most recent being in January 2020. These data have been used to image the CO2 storage reservoir and track the extent of the CO2 plume and verify caprock integrity.11Silixa. [n.d.]. Verifying safe CO2 storage with VSP surveys at Aquistore, Saskatchewan, Canada. Retrieved July 6, 2021, from https://silixa.com/wp-content/uploads/Verifying-safe-CO2-storage-with-VSP-surveys.pdf

Map view of monitoring surveys conducted after 36 kt, 102 kt and 141 kt of CO2 were injected into the storage reservoir. Extent of CO2 plume monitored over time with 3D Distributed Acoustic Sensing (DAS) VSP surveys recorded on a fiber-optic cable is shown by warmer colors. Injection well (INJ) and observation (OBS) well are indicated on the map.12Don White, Geological Survey, Canada
Image Credits
- 1 vertical seismic: R. Giese
- 2 vertical seismic: National Energy Technology Laboratory
- 3 vertical seismic: Feo et al.
- 5 vertical seismic: Wtshymanski