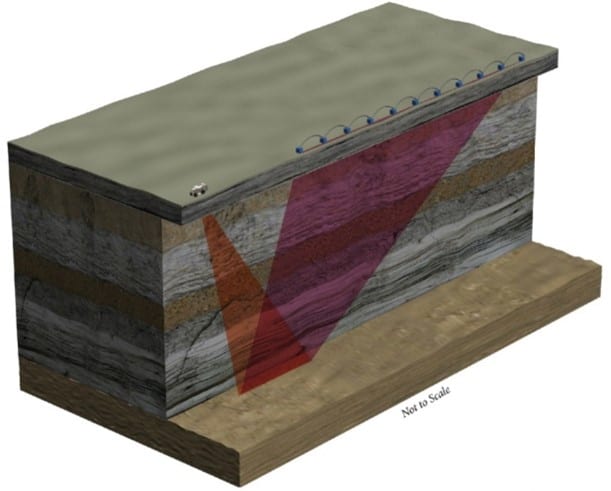
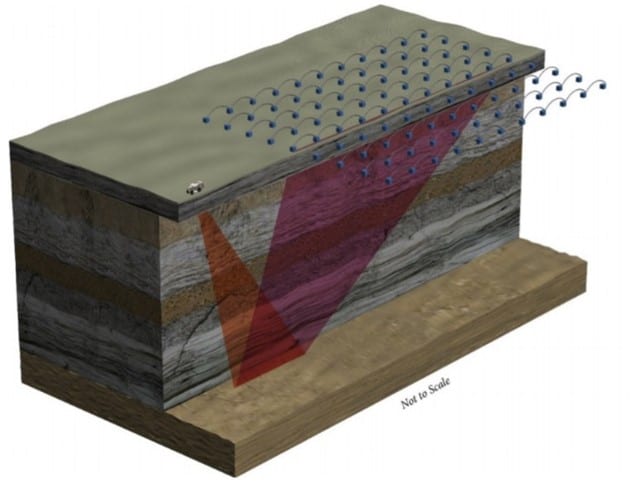
Both 2-D and 3-D seismic surveys use a seismic source and a set of receivers located at the surface to infer properties of the subsurface using seismic reflections. 2-D seismic surveys provide information about the subsurface along a single depth profile. Whereas, 3-D seismic surveys provide information about the subsurface within the volume underneath the seismic grid.1Plains CO2 Reduction Partnership. (2018, March). Best practices manual – monitoring for CO2 storage. https://undeerc.org/pcor/images/resources/Monitoring%20for%20CO2%20Storage.pdf


Two-dimensional seismic surveys deploy the receivers in a single line, send seismic waves into the ground, and record the seismic reflections that come back. Three dimensional seismic surveys use the same technique, but instead of arranging receivers in a single line, they deploy a grid layout (seismic array) to measure seismic reflections in a plane at the surface.2Hamling, J.A., Gorecki, C.D., Steadman, E.N., and Harju, J.A., 2011, Subtask 1.3 – Evaluation of geophysical technologies for application to CCS: Final topical report prepared for National Energy Technology Laboratory under Cooperative Agreement No. DE-FC26-08NT43291, Grand Forks, North Dakota, Energy & Environmental Research Center.
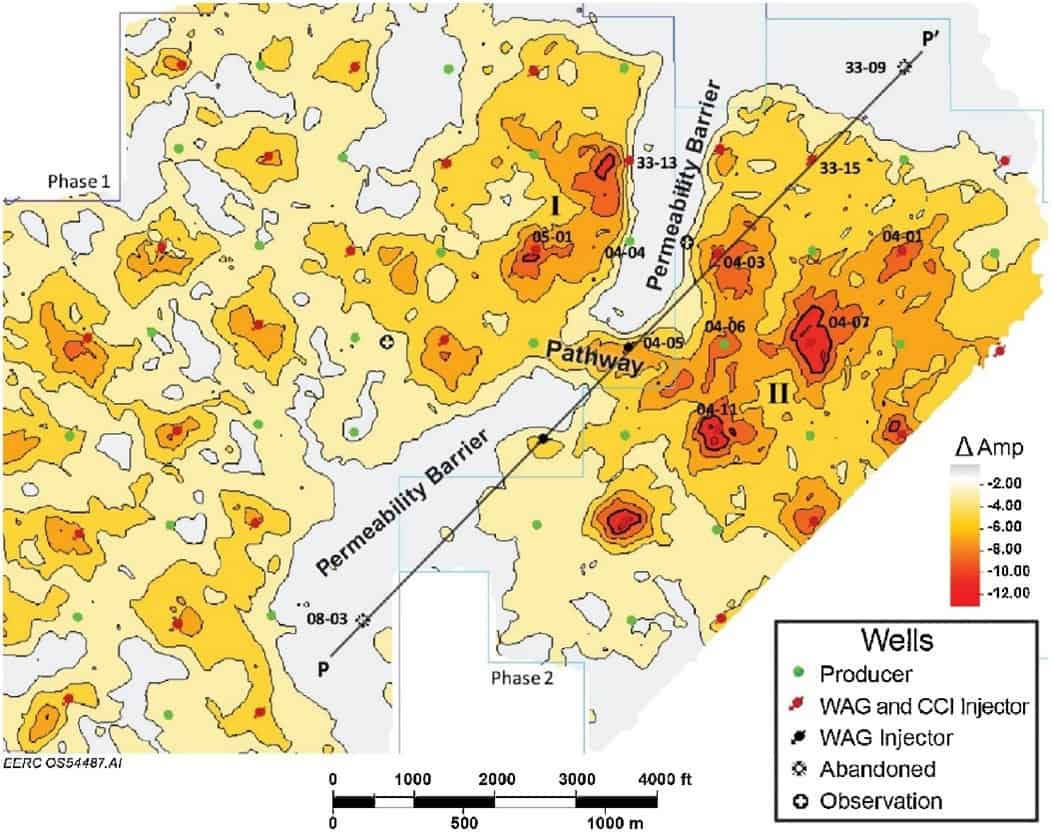
Both 2-D and 3-D seismic surveys are frequently part of monitoring programs because they provide data for large regional volumes of the subsurface. Multiple seismic surveys can be collected over time; and the change from one survey to the next represents a fourth dimension: time. These repeat seismic surveys are termed “time-lapse” or “4-D” seismic surveys. The 4-D seismic technique can shed light on the changing reservoir environment through time, particularly with regard to the movement of CO2. For example, the presence of CO2 will change the fluid properties within the reservoir, which shows up as a change in the seismic amplitude between the baseline (pre-injection) survey and later operational surveys. As a result, areas of the reservoir that contain CO2 will have a greater amplitude difference in the operational 4-D seismic survey. The magnitude of the amplitude difference will be proportional to the amount of CO2.3Plains CO2 Reduction Partnership. (2018, March). Best practices manual – monitoring for CO2 storage. https://undeerc.org/pcor/images/resources/Monitoring%20for%20CO2%20Storage.pdf
Surface Seismic Reflection Summary
- Description: Seismic geophysical methods use acoustic energy to image the subsurface. Differences between the acoustic properties of CO2 and other fluids enable plume monitoring by seismic methods. Active seismic methods, such as surface seismic reflection, require a source and receiver.
- Benefits: Substitution of CO2 for brine under many conditions creates a strong change in seismic velocity ideal for time-lapse quantification from pre-injection baseline (brine-filled) pores to pores partly filled with CO2. Reflection seismic under the right conditions is useful both for time-lapse monitoring of a CO2 plume and for identification of any out-of-zone CO2 accumulation indicating a release. Surface seismic surveys can assess large areas and large thicknesses completely (as compared to point measurements).
- Challenges: Repeatability of seismic survey needed for time-lapse surveys may be difficult under varying surface conditions. Geologic complexity and a noisy recording environment can degrade or attenuate surface seismic data and the presence of gas in baseline fluids can reduce detection of CO2. Surface seismic data generally have lower spatial resolution than borehole seismic data and may not image thin zones.4National Energy Technology Laboratory. (2017). Best practices: Monitoring, verification, and accounting (MVA) for geologic storage projects. National Energy Technology Laboratory, U.S. Department of Energy. https://netl.doe.gov/sites/default/files/2018-10/BPM-MVA-2012.pdf
Application
A seismic reflection survey (3-D survey) can be used for site characterization prior to injection and can serve as the baseline against which repeat surveys can provide time-lapse monitoring (4-D surveys). Changes in reflectivity between surveys can be interpreted as the result of the migration of a CO2 plume in the subsurface, and in some cases increase in pressure. Analysis of time-lapse 3-D seismic surveys is a well-established oil industry tool, so developments for geologic storage to some extent track oil industry practice.5National Energy Technology Laboratory. (2017). Best practices: Monitoring, verification, and accounting (MVA) for geologic storage projects. National Energy Technology Laboratory, U.S. Department of Energy. https://netl.doe.gov/sites/default/files/2018-10/BPM-MVA-2012.pdf
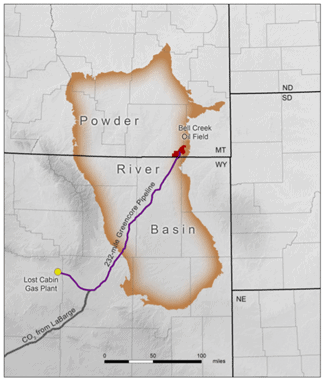
These techniques were applied to monitoring of CO2 injection as part of a study of storage associated with a large-scale commercial enhanced oil recovery project at the Denbury-operated Bell Creek Oil Field in Montana. Carbon dioxide is delivered via pipeline from two gas processing plants in Wyoming, where it is separated out during natural gas refinement.6National Energy Technology Laboratory. (2017). Best practices: Monitoring, verification, and accounting (MVA) for geologic storage projects. National Energy Technology Laboratory, U.S. Department of Energy. https://netl.doe.gov/sites/default/files/2018-10/BPM-MVA-2012.pdf

Map depicting the location of the Bell Creek oil field in relation to the Powder River Basin and the 232-mile Greencore pipeline route to the Bell Creek oil field. CO2 is sourced from the ConocoPhillips-operated Lost Cabin Gas Plant and the ExxonMobil Shute Creek Gas Plant in LaBarge, Wyoming.7National Energy Technology Laboratory. (n.d.). Bell Creek Field Project. Retrieved July 1, 2021, from https://www.netl.doe.gov/sites/default/files/2018-11/Bell-Creek-Project.pdf
Multiple surveys have been conducted over time and provide a means of tracking the progression of the CO2 plume in the reservoir, which has helped better manage injection operations, as well as the timing and location of other monitoring techniques.8National Energy Technology Laboratory. (2017). Best practices: Monitoring, verification, and accounting (MVA) for geologic storage projects. National Energy Technology Laboratory, U.S. Department of Energy. https://netl.doe.gov/sites/default/files/2018-10/BPM-MVA-2012.pdf

4-D seismic map showing change in amplitude (Δamp) of the injection zone at the Bell Creek CO2 enhanced oil recovery project between seismic surveys. Warmer colors indicate regions that have experienced greater change in CO2 saturation since the baseline seismic survey. The CO2 response outlines a buildup of CO2 banking against a barrier to permeability (contours are close together near ‘I’), and then a communication Pathway between two Permeability Barriers.9National Energy Technology Laboratory. (2017). Best practices: Monitoring, verification, and accounting (MVA) for geologic storage projects. National Energy Technology Laboratory, U.S. Department of Energy. https://netl.doe.gov/sites/default/files/2018-10/BPM-MVA-2012.pdf
Image Credits
- 2 dimensional seismic survey 1: National Energy Technology Laboratory
- 2 dimensional seismic survey 2: National Energy Technology Laboratory